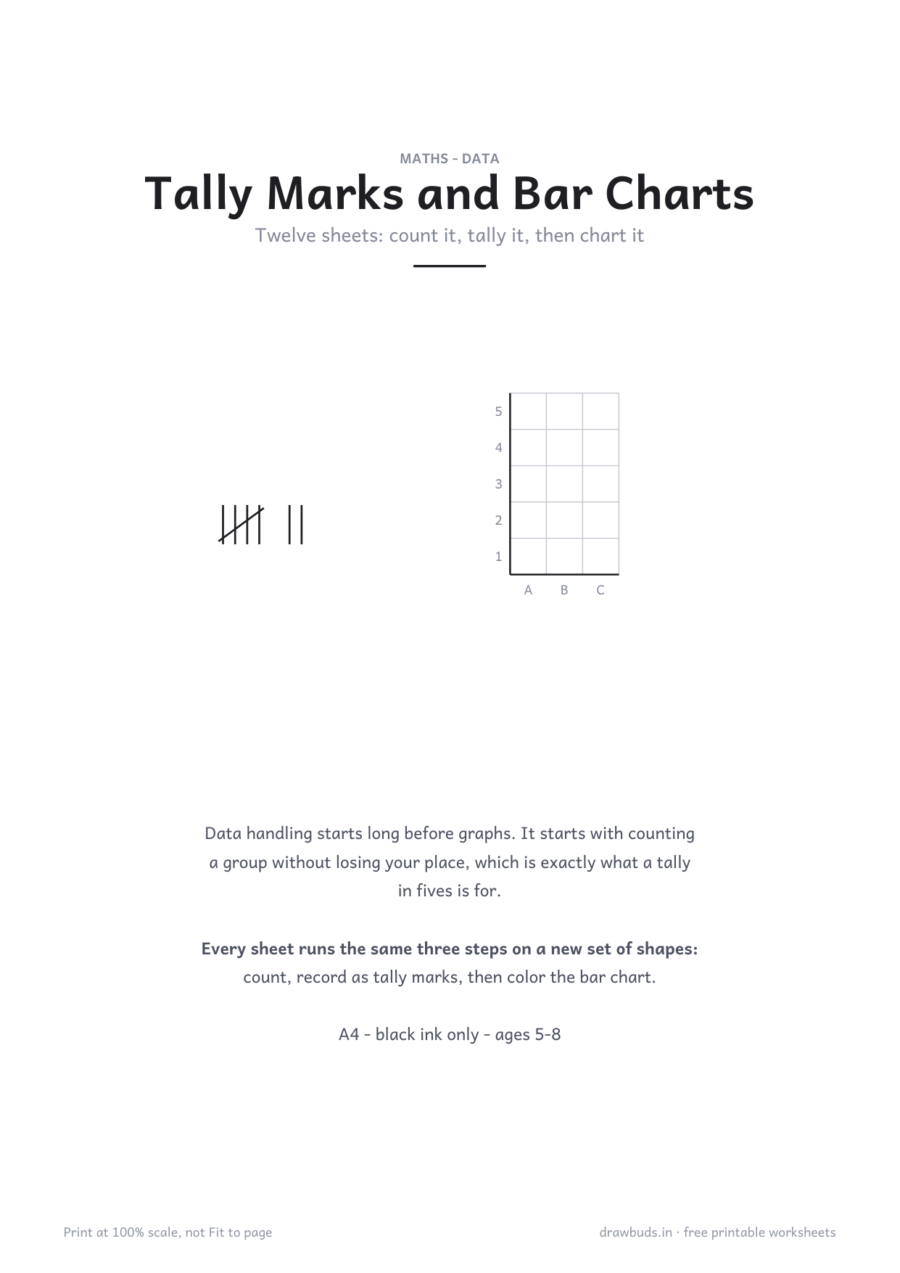
Tally Marks and Bar Charts
13 printable pages. Count the shapes, record them as tally marks, then color the bar chart — the same three steps on twelve different sets of data.
- Pages
- 13
- Ages
- 5-8
- Paper size
- A4
- Black ink only
Free to print at home, at school, and in a classroom of thirty.
Count, tally, then color the chart - the same three steps on twelve sets
Data handling starts long before graphs. It starts with counting a group of things without losing your place, which is exactly what a tally in fives is for, and it ends with a picture that answers a question faster than the numbers do.
Every sheet in this book runs the same three steps on a new set of shapes.
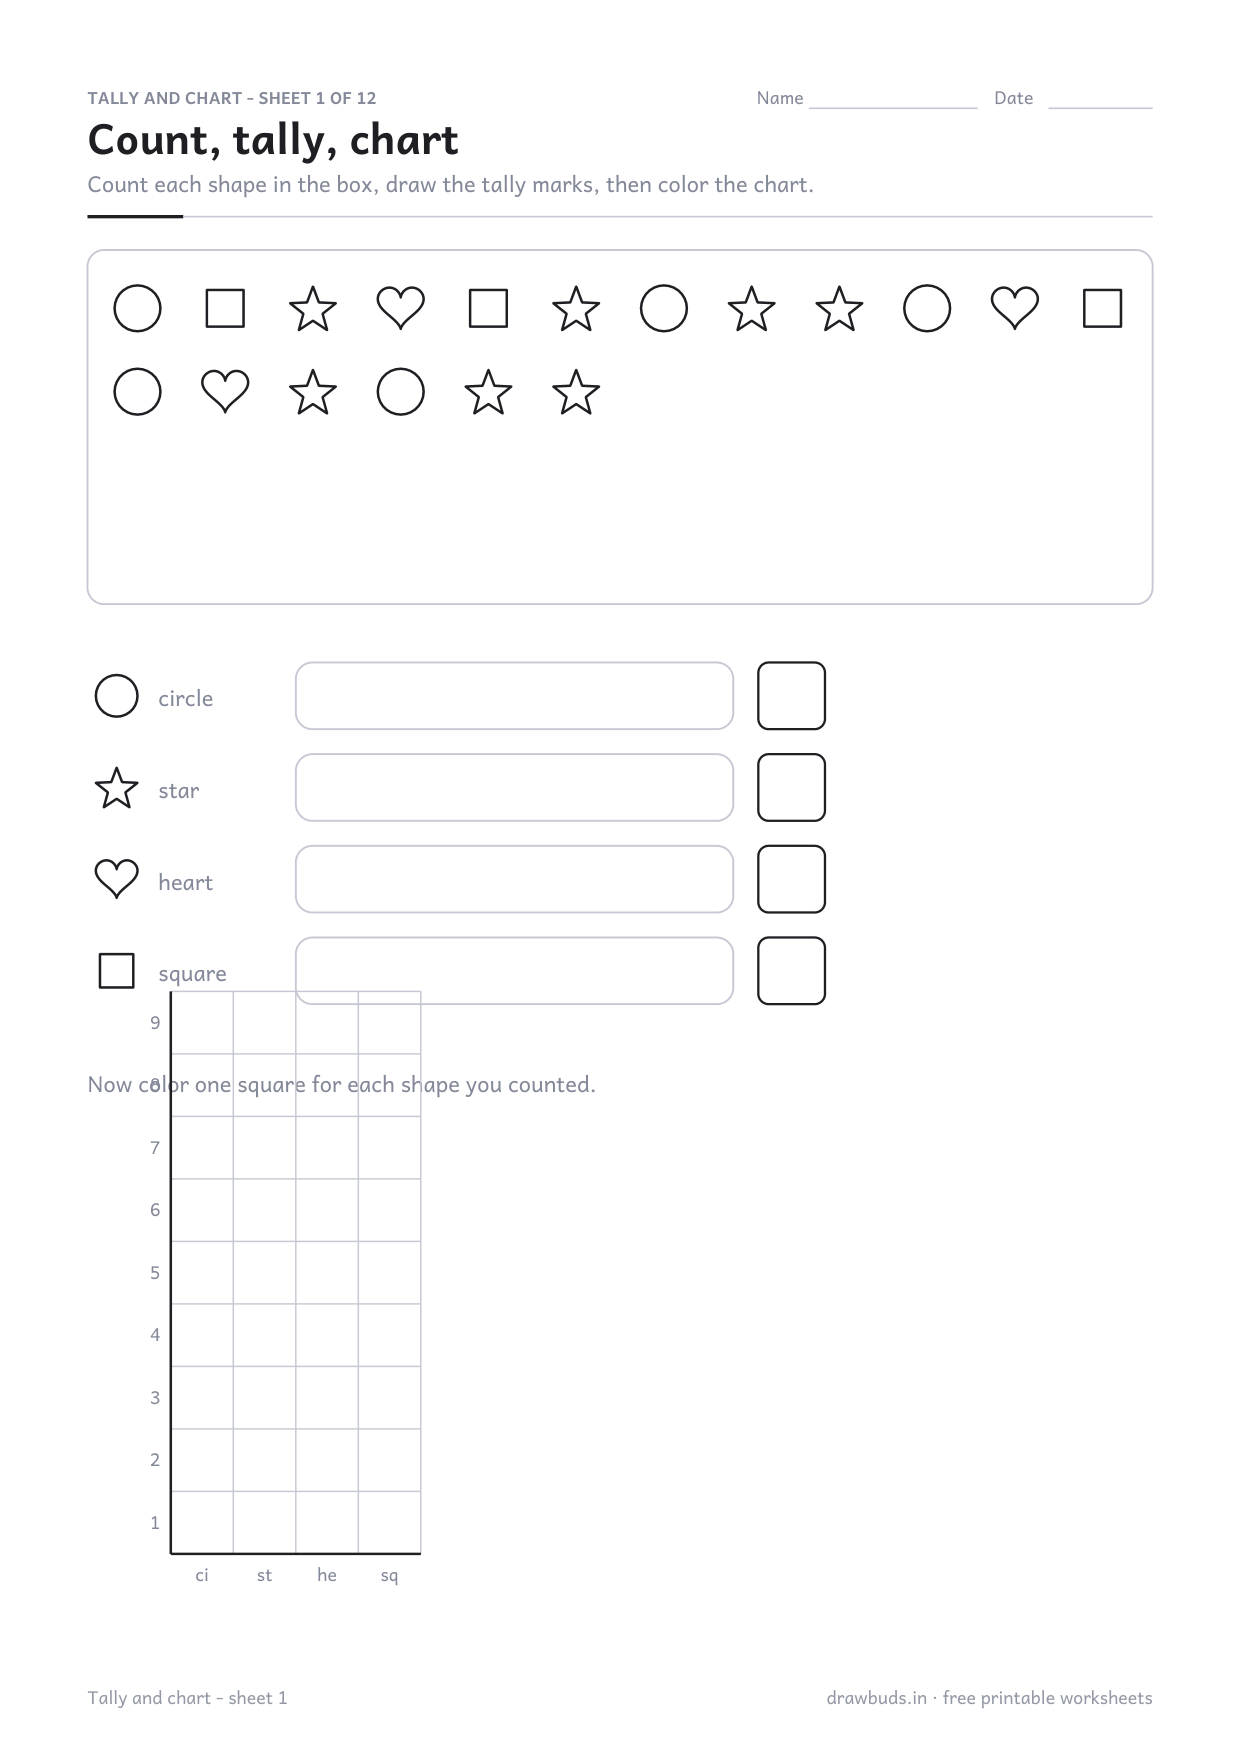
The three steps
- Count. A box of mixed shapes, scattered rather than sorted — circles, stars, hearts and squares all jumbled together, so they have to be picked out rather than counted in a row.
- Tally. A row for each shape, with space to draw the marks and a box for the total.
- Chart. An empty bar chart at the bottom, one column per shape, to be colored up to the count.
Why the fifth mark goes across the other four
Because five is the largest group most people can read at a glance without counting. Four upright marks and a diagonal is a shape; six upright marks is a thing you have to count. That is the whole reason tallying exists, and it is worth saying to a child who thinks the diagonal is just decoration.
Reading the chart afterwards
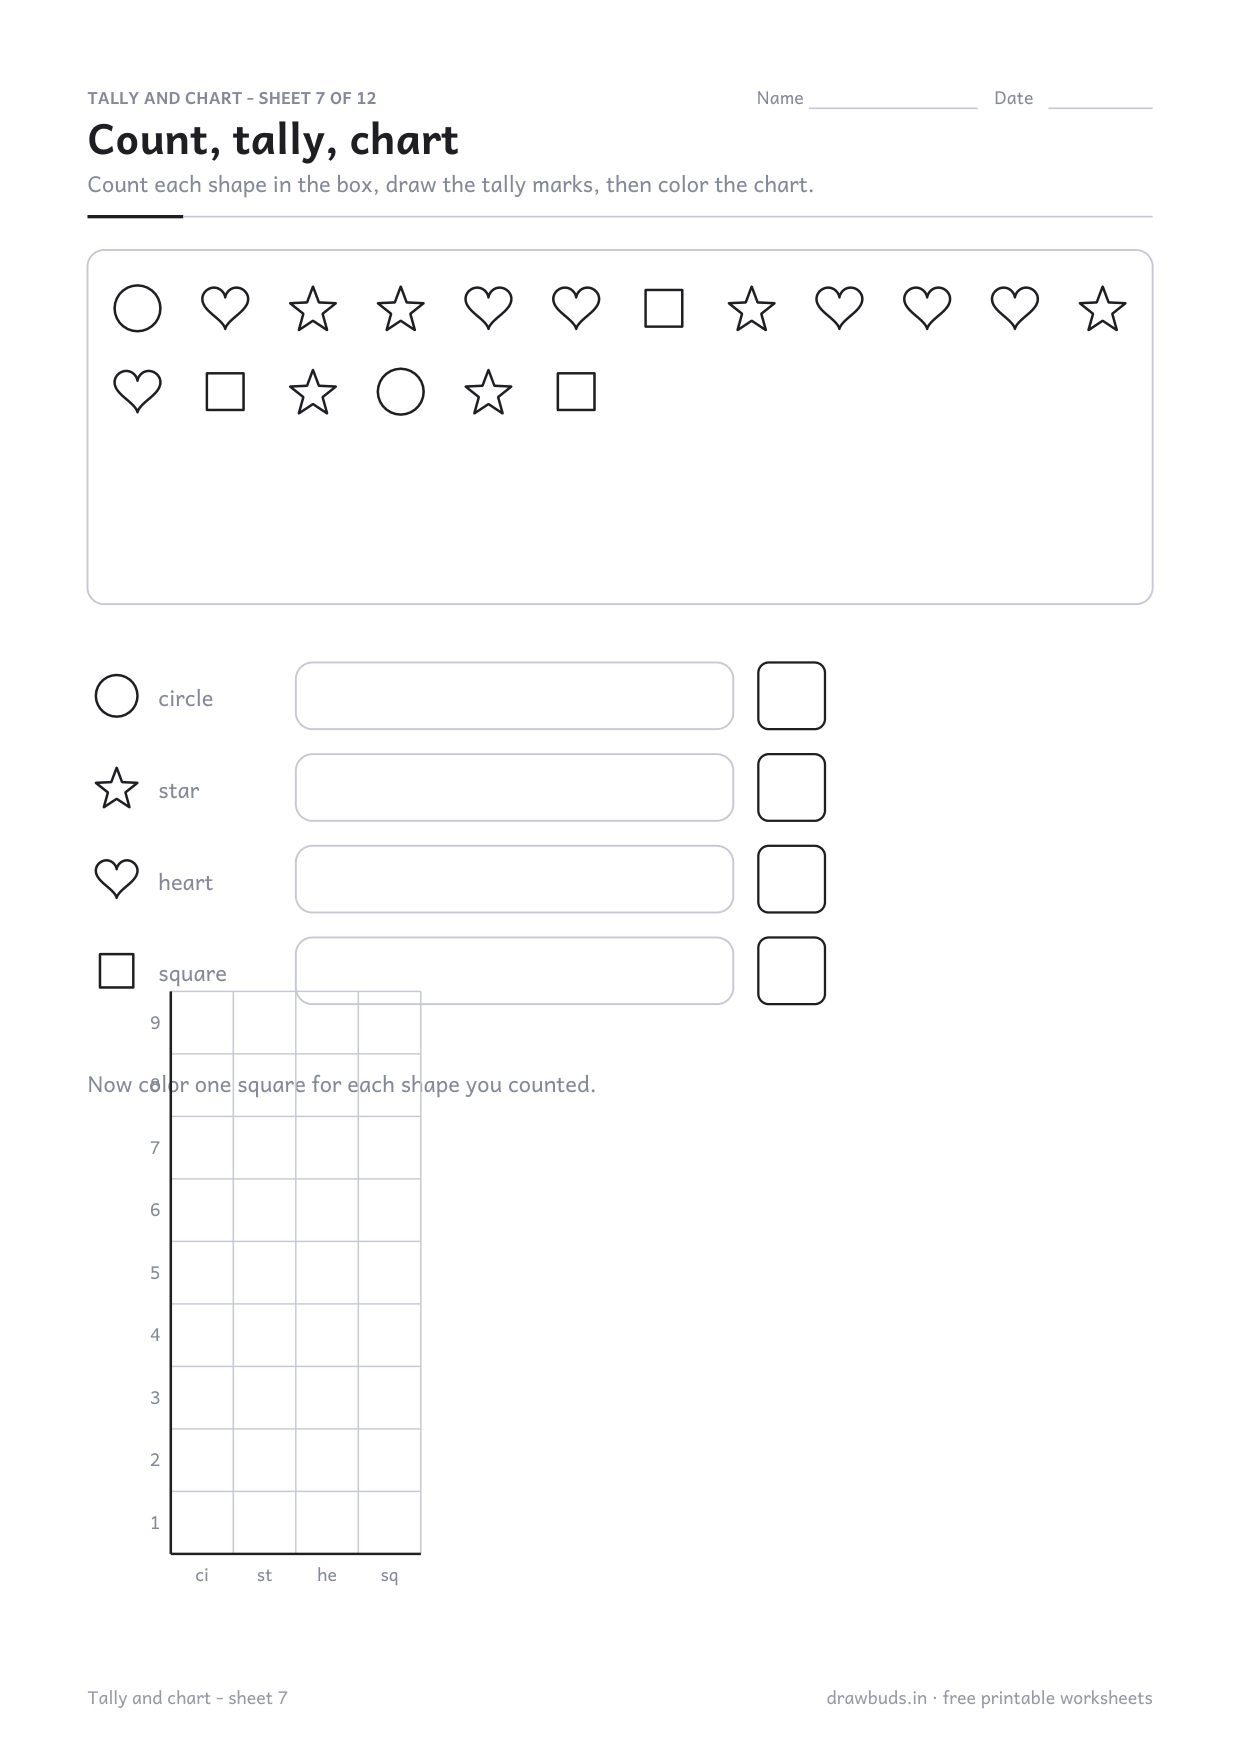
The chart is not the end of the exercise. Ask three questions once it is colored: which shape was there most of, which least, and how many more of one than the other. The last question is the one that turns a colouring task into maths, and it is a subtraction that a child can check by looking.
Collect real data too
The best version of this sheet is not printed. Count the cars that go past in ten minutes, by colour. Count what everyone in the house had for breakfast. Then tally and chart it with the same three steps. The printed sheets are practice for that, not a substitute.
What comes next
Counting Worksheets 1-20 if the counting itself is unreliable, and More, Less or Equal for the comparing questions the chart invites.
Printing this one correctly
In your printer dialog set Scale to 100% or Actual size, not Fit to page. Fit to page shrinks the tracing letters and they stop matching the size a child's hand is learning.
Plain paper is fine for crayons and pencils. If your child uses felt pens, 100 gsm paper stops the ink bleeding to the next sheet.